Search This Blog

Showing posts with label states. Show all posts

Tuesday, September 15, 2026

Governors Push Back on DOJ's Efforts to Undercut Olmstead

 In The Politics of Autism, I discuss court cases involving the civil rights of people with autism and other disabilities. 


In August, the Department of Justice quietly released a memo pertaining to the landmark 1999 disability civil rights case Olmstead v. L.C.  That precedent, the memo claimed without evidence, increases homelessness.

Eighteen governors signed a letter asking the Justice Department to stop its efforts to undercut enforcement of the Olmstead decision.  

For nearly four decades, the Americans with Disabilities Act (ADA) has embodied a fundamental national commitment that disability should not be a basis for exclusion or diminished opportunity.  States have worked with local and federal government partners since 1990 to implement both the letter and spirit of this much-celebrated, bipartisan law.  On June 18, 2026, the Department of Justice’s Office of Legal Counsel issued a legal opinion that questions the longstanding legal framework surrounding the rights of Americans with disabilities to live with dignity, independence, and full community participation.  On July 20, 2026, the DOJ declared that it will not rely on its own longstanding Olmstead guidance, issued June 22, 2011. 

As Governors, we are deeply concerned by the federal government’s retreat from its longstanding role in protecting the right to community integration and that such actions signal changes to programs serving individuals with disabilities. For more than 25 years, the Supreme Court’s landmark decision in Olmstead v. L.C. has built on the commitment of the ADA and reinforced the principle that people with disabilities should have the opportunity to live, work, receive services, and participate in their communities rather than being unnecessarily segregated in institutional settings. This is a principle Americans are proud of and is a Northstar internationally for people with disabilities. 

This principle has changed lives and transformed this country. Red and blue states have spent decades investing in home and community based services, developing supportive housing, expanding access to education and employment opportunities, and redesigning and strengthening community based services.  These efforts reflect not only our progress under federal civil rights law, but our shared conviction that people with disabilities belong in their communities, whenever possible.  

Recent actions have already created significant uncertainty for states and for the workforce of dedicated individuals who support people with disabilities throughout the country.  More importantly, people with disabilities and their families are terrified about moving backwards - or worse - becoming institutionalized against their will - after decades of advocacy.  We simply cannot risk reversing the progress this country has made in ensuring Americans with disabilities have meaningful choices about where and how they live their lives.   

We strongly oppose any federal actions that would weaken protections against unnecessary segregation or diminish the right of people with disabilities to receive services in the most integrated settings appropriate to meet their needs, consistent with established Olmstead precedent.  Community integration is not an abstract legal concept. It means having a home, being able to work, attend school, shop, worship, build relationships, and participate in an ordinary civic life.  

This is not a partisan issue. The ADA was enacted with overwhelming bipartisan support and signed into law by President George H.W. Bush. The continued movement toward community-based services has progressed under Republican and Democratic administrations and in states led by Governors of both parties.  States may differ in how we administer these services but we stand united around the basic principle that Americans with disabilities are full members of our communities and should not be forced into segregation to receive the services and support they need.   

We stand ready to work with the Administration and Congress to strengthen community-based systems while preserving individual choice.  We must ensure that our nation continues moving toward greater independence, inclusion, and opportunity for all Americans with disabilities.  We urge you not to turn back the clock on generations of progress.  

  •  Governor Kathy Hochul State of New York 
  • Governor Ned Lamont State of Connecticut 
  • Governor JB Pritzker State of Illinois 
  • Governor Wes Moore State of Maryland 
  • Governor Gretchen Whitmer State of Michigan 
  • Governor Mikie Sherrill State of New Jersey 
  • Governor Katie Hobbs State of Arizona 
  • Governor Matt Meyer State of Delaware 
  • Governor Janet Mills State of Maine 
  • Governor Maura Healey State of Massachusetts 
  • Governor Tim Walz State of Minnesota 
  • Governor Michelle Lujan Grisham State of New Mexico 
  • Governor Josh Stein State of North Carolina 
  • Governor Josh Shapiro State of Pennsylvania 
  • Governor Bob Ferguson State of Washington 
  • Governor Tina Kotek State of Oregon 
  • Governor Dan McKee State of Rhode Island 
  • Governor Tony Evers State of Wisconsin 

Tuesday, August 18, 2026

Vaccine Exemptions

In The Politics of Autism, I analyze the myth that vaccines cause autism. This bogus idea can hurt people by allowing diseases to spread. Examples include measles, COVID, flu, and polio. A top antivaxxer is HHS Secretary RFK Jr. He is part of the "Disinformation Dozen." He helped cause a deadly 2019 measles outbreak in Samoa.

Since  Trump took office in 2025, the U.S. has recorded more confirmed measles cases than in the previous 20 years combined.

Lena H. Sun at WP:

The share of U.S. kindergartners with exemptions from school vaccine requirements for the 2025-2026 school year rose to another record high, according to federal data posted Monday. The sharp increase from 3.6 to 4.2 percent seeking exemptions — about 155,000 students — extends a years-long erosion of childhood immunization rates as the country battles its worst measles resurgence in 35 years.

As exemptions increased, U.S. kindergarten vaccination rates fell slightly for all reported vaccines from the year before. Coverage for the major vaccines required for kindergarten — MMR (measles, mumps and rubella); DTaP (diphtheria, tetanus and acellular pertussis); poliovirus vaccine (polio); and varicella (chicken pox) — decreased in more than half of states for the second year in a row, the CDC said.

Via Claude:

For the 2025–26 school year, using the "Any Exemption" rate among kindergartners, these states had exemption rates of 5% or higher: [data missing for Montana]

RankStateExemption Rate
1Idaho17.5%
2Utah12.7%
3Oregon11.0%
4Arizona10.6%
5Nevada8.7%
6Alaska8.6%
7Wisconsin8.2%
8North Dakota8.1%
9Michigan7.7%
10Oklahoma7.4%
11Wyoming7.2%
12 (tie)South Dakota6.9%
12 (tie)Minnesota6.9%
14Missouri6.3%
15 (tie)Pennsylvania6.0%
15 (tie)Hawaii6.0%
17Florida5.9%
18 (tie)New Jersey5.7%
18 (tie)South Carolina5.7%
18 (tie)Ohio5.7%
21New Hampshire5.4%
22Washington5.3%
23Texas5.2%
24Georgia5.1%

Monday, August 17, 2026

Special Ed Complaints in the States

 In The Politics of Autism, I write about social services, special education, and the Individuals with Disabilities Education Act. 

Kara Adundel at K-12 Dive:

State education agencies saw a 46% jump in the number of written state complaints in special education during the 2025-26 school year compared to the year before, according to new survey responses from 31 states.

The self-reported survey data, collected by the Council for Exceptional Children and the National Association of State Directors of Special Education, shows that during the 2024-25 school year there were 7,907 written state complaints. That number rose to 11,523 in the 2025-26 school year.

Written state complaints trigger a state-led investigation into a special education-related concern brought forward by anyone, which can include parents and community members. There is no cost to filing a written state complaint, unlike special education due process complaints, which typically involve assistance from an attorney.

CEC and NASDSE said that while there is no single reason for the increased rate of written state complaints, many families have reported a lack of faith in the U.S. Department of Education’s Office for Civil Rights to resolve their concerns, the organizations said.

During the second Trump administration, OCR has significantly reduced its workforce and closed seven of 12 regional offices that assist with reviewing and investigating K-12 and higher education discrimination complaints filed to the Education Department.

A U.S. Government Accountability Office report in February found that between March and September 2025, OCR received more than 9,000 complaints and resolved 7,072 of those complaints, mainly by dismissing 90% of them.


Sunday, April 26, 2026

Variation in Autism Diagnosis of Medicaid-Enrolled Children


A release from the Pediatric Academic Societies:
 A new study examined geographic patterns in autism diagnosis by primary care providers among Medicaid-enrolled children in 29 states. The study found that Nevada, South Carolina and Connecticut had the highest rates of autism diagnosis by primary care providers. Findings from the study will be presented at the Pediatric Academic Societies (PAS) 2026 Meeting, taking place April 24-27 in Boston. This study is part of a larger research project, Addressing Structural Disparities in Autism Spectrum Disorder through Analysis of Secondary Data (ASD3), which is funded by the National Institutes of Health.

An autism spectrum disorder (ASD) diagnosis by a medical provider is often required for disability and therapy services access. Given long wait times and limited access to specialty care providers who typically diagnose ASD, some states have expanded primary care provider ASD diagnostic training. Yet little research has examined geographic patterns in primary care providers ASD diagnosis.

"Autism is typically diagnosed by specialists, but various factors such as long wait times can delay this process,” said the ASD3 investigative team. “Primary care providers can offer an additional pathway to early diagnosis, which is important for improving access to needed autism services and supports. Our study looked at Medicaid-enrolled children ages 1-5 in 29 states between 2017-2019, and found that 29% were diagnosed by primary care providers rather than specialists. Rates of autism diagnosis by primary care providers varied significantly between counties, states and regions. We believe that local practice patterns and specialist availability may contribute to this geographic variation."

The sample included 36,263 children across 933 county-sets in 29 states. Overall, 29% of children were diagnosed with ASD by a primary care provider. Regional percentages varied from a median of 20.0% among county-sets in the Midwest to 36.4% in the West. Within-region variation was also high, with interquartile ranges (IQRs) varying from 23.8% in the Midwest to 27.5% in the West. Within-region variation was also high when grouping county-sets by state. For example, the Northeast had both the third highest state (Connecticut, 53.1%) and the third lowest state (New Hampshire, 14.3%) as measured by their median county-set. The neighboring states of South Carolina (60.4%) and Georgia (17.9%), both in the South region, ranked second highest and fifth lowest, respectively. Within-state heterogeneity (IQR) was as low as 6.2% (Connecticut), 9.6% (New Hampshire), and 12.7% (Georgia) and as high as 35.7% (Colorado), 37.6% (Illinois), and 42.3% (Wyoming). Population density showed a slight trend with the densest quartile of county-sets having a median primary care provider diagnosis rate of 24.2%, and 28.6% for the least dense quartile.


Thursday, March 19, 2026

ABA Funding Turmoil

The Politics of Autism includes an extensive discussion of insurance and Medicaid services for adults with intellectual and developmental disabilities. Cases of fraud and overbilling have led to a backlash.

Maya Goldman at Axios:

Where it stands: States and Medicaid managed care plans are scrutinizing more autism program spending and imposing cost controls.

  • Nebraska cut Medicaid payments for applied behavioral analysis by up to 80% last year. Indiana policymakers have proposed payment caps and reduced rates. New York is considering legislation that would make similar changes.
  • Medicaid managed care insurers like UnitedHealth Group have also limited coverage for applied behavioral analysis in some states.

Yes, but: The changes are causing significant upheaval for families that have been using applied behavioral analysis.

  • One mother in Arizona told Axios Phoenix that her 3-year-old son spent eight months on a waitlist for services before he got into a program last year.
  • Their insurance plan has since removed the provider from its network. The mother said she'll probably have to quit her job when her son loses coverage for his 40-hour-a-week therapy in May.
  • North Carolina reversed some cuts to Medicaid payment for applied behavioral analysis services last year after families of kids with autism sued the state.

Wednesday, November 5, 2025

Without Federal Oversight, Special Education Will Likely Deteriorate

  In The Politics of Autism, I discuss the issue's role in presidential politics. Many posts have discussed Trump's bad record on disability issues. As his words and actions have shown, he despises Americans with disabilities. He told his nephew Fred that severely disabled people -- such as Fred's son -- should "just die."

Project 2025 proposed to turn IDEA into a "no strings" block grant, effectively gutting the law and destroying protections that disability families have long relied upon. During the 2024 race, Trump denied any connection to the project, but now he proclaims it, praising OMB director Russ Vought "of Project 2025 fame."

Trump and Vought are now accomplishing their goal of ravaging the law. Instead of shifting it to a block grant, they are firing most of the staff who enforce it.  A judge has temporarily paused the attack, but the administration will likely find ways to ignore or circumvent the order.

Anna Claire Vollers at Stateline:

The court ruling halting the layoffs is likely just a temporary setback as Trump proceeds with his broader mission of closing the federal department. Trump and Education Secretary Linda McMahon have said their goals are to reduce bureaucracy and return more education responsibilities to the states.

Neither the Department of Education nor the White House, which are operating with fewer communications officers because of the government shutdown, responded to Stateline requests for comment.

Congress has never fully funded special education at 40% per-pupil costs promised to states under IDEA. Funding has fluctuated over the years; in 2024, it was about 10.9%. Federal IDEA funding is expected to continue, though without federal oversight from the Education Department.

Disability rights and education advocates worry that most states don’t have the resources — or, in some cases, the will — to adequately police and protect the rights of students with disabilities.

years have failed to provide adequate special education services, prompting investigation from the feds. Just 19 states meet the requirements for serving students with disabilities from ages 3 through 21, according to the most recent annual review from the Department of Education, released in June.

...
The federal government currently covers less than 12% of the costs of special education services nationwide, leaving state and local governments to foot the rest, according to the National Education Association, a labor union representing 3 million educators nationally. Without federal oversight, critics fear, nobody will hold states and school districts accountable for not spending enough.

In some states, limited state funding means a disproportionate financial burden lands on individual school districts. On average, local districts are responsible for $8,160 per special education student per year, according to a report released last year by education nonprofit Bellwether that studied funding across 24 states.

Wednesday, May 28, 2025

Early Diagnosis and Medicaid


Lay abstract:
In the United States, when children on the spectrum are diagnosed before age three, it can help them get the services they need to thrive. There are many differences between states as far as how many children are diagnosed with autism and the average age when they are diagnosed. Some work suggests these differences may be due to state polices, which include the laws and processes governments and organizations follow. Little research has tried to understand the similarities and differences between state policies related to autism diagnosis. Because of this, our study looked at how state policies impact the timing of autism diagnosis in the United States. We interviewed 57 experts in five states and nationally from 2021 to 2023. Four key themes were identified including (1) developmental monitoring often leads to screening, but there is much variation in and across states; (2) family, community, and healthcare factors shape pathways to autism diagnosis in states; (3) early intervention and education programs play a role in autism diagnosis; and (4) systematic differences in access to diagnosis services persist for certain groups of children and families such as those with limited English-speaking abilities. This study’s findings point to certain state and federal policy changes or enhancements to reduce the age of autism diagnosis and ameliorate persistent disparities in autism diagnosis.
From the article:
Many participants noted that children with Medicaid often have a more challenging time obtaining autism evaluation due to low reimbursement rates and limited providers who will accept Medicaid coverage for autism evaluation across the five states. These challenges with Medicaid coverage and access to autism diagnostic services were attributed to longer wait times for poor and rural families, thereby perpetuating inequity in early autism diagnosis. According to one participant:
We have [. . .] approximately 50, that I know of, professionals that can diagnose autism. Or actively do. Out of that 50, there’s probably five, that I know, who are quality, qualified autism experts that accept AHCCCS [Arizona Health Care Cost Containment System, Medicaid] payments for those evaluations. So, if you don’t have private insurance or you can’t afford a private evaluation, you are . . . sent to Phoenix Children’s Hospital. And their wait list is . . . 12 to 18 months. (Participant 33, Arizona)
Participants additionally explained that when an autism evaluation does not yield a diagnosis, parents may be forced to pay out of pocket for the evaluation because their insurance plan will not cover the cost. Nevertheless, participants explained how some healthcare organizations have determined ways to ensure that children with Medicaid receive an autism diagnosis. For example, several participants described that some academic medical centers could pursue supplemental payment for low Medicaid reimbursement rates through state programs such as early and periodic screening, diagnostic, and treatment (EPSDT). Some participants elaborated that Medicaid coverage may be a greater barrier to early diagnosis in states where the Medicaid program does not accept autism as a qualifying diagnosis (regardless of income) for eligibility.

Monday, August 12, 2024

Special Education Inconsistencies

 In The Politics of Autism, I discuss social services, special education, and the Individuals with Disabilities Education Act. 

Beth Hawkins at The 74:

An early look at new special education datasets reveals massive inconsistencies in how many children states are identifying as needing services, how much is being spent on them and whether that funding is tied to better outcomes, according to Marguerite Roza, director of Georgetown University’s Edunomics Lab.

Preliminary though the research is, even the broad takeaways are especially timely, Roza recently told a group of policymakers, educators and journalists. The number of students with disabilities has risen dramatically over the last decade, as has the share of school budgets dedicated to paying for special education.

“Historically, our tendency has been to look the other way on special ed spending,” she said. “It hasn’t gotten the same scrutiny [as] other elements in the district budget.”

One immediate takeaway is that states that provide sound literacy instruction for all students also post better reading scores for special education students, Roza noted. Case in point: Mississippi, where recent, dramatic gains in literacy have been credited to a 10-year push by state officials to ensure evidence-based reading instruction is taking place in every classroom.

Mississippi is one of two states that dedicated the smallest portion of its education budget — some 8% — to meeting the needs of special education students, yet it is one of four where children with disabilities perform the highest on the reading portion of the National Assessment of Educational Progress.


Tuesday, July 16, 2024

State of the States on IDD

The Politics of Autism includes an extensive discussion of insurance and  Medicaid services for adults with intellectual and developmental disabilities. 

Kansas University Center on Developmental Disabilities, and director, State of the States in Intellectual and Developmental Disabilities project
In FY2021, 87% of the total public funding for IDD services was distributed through Medicaid-related services.
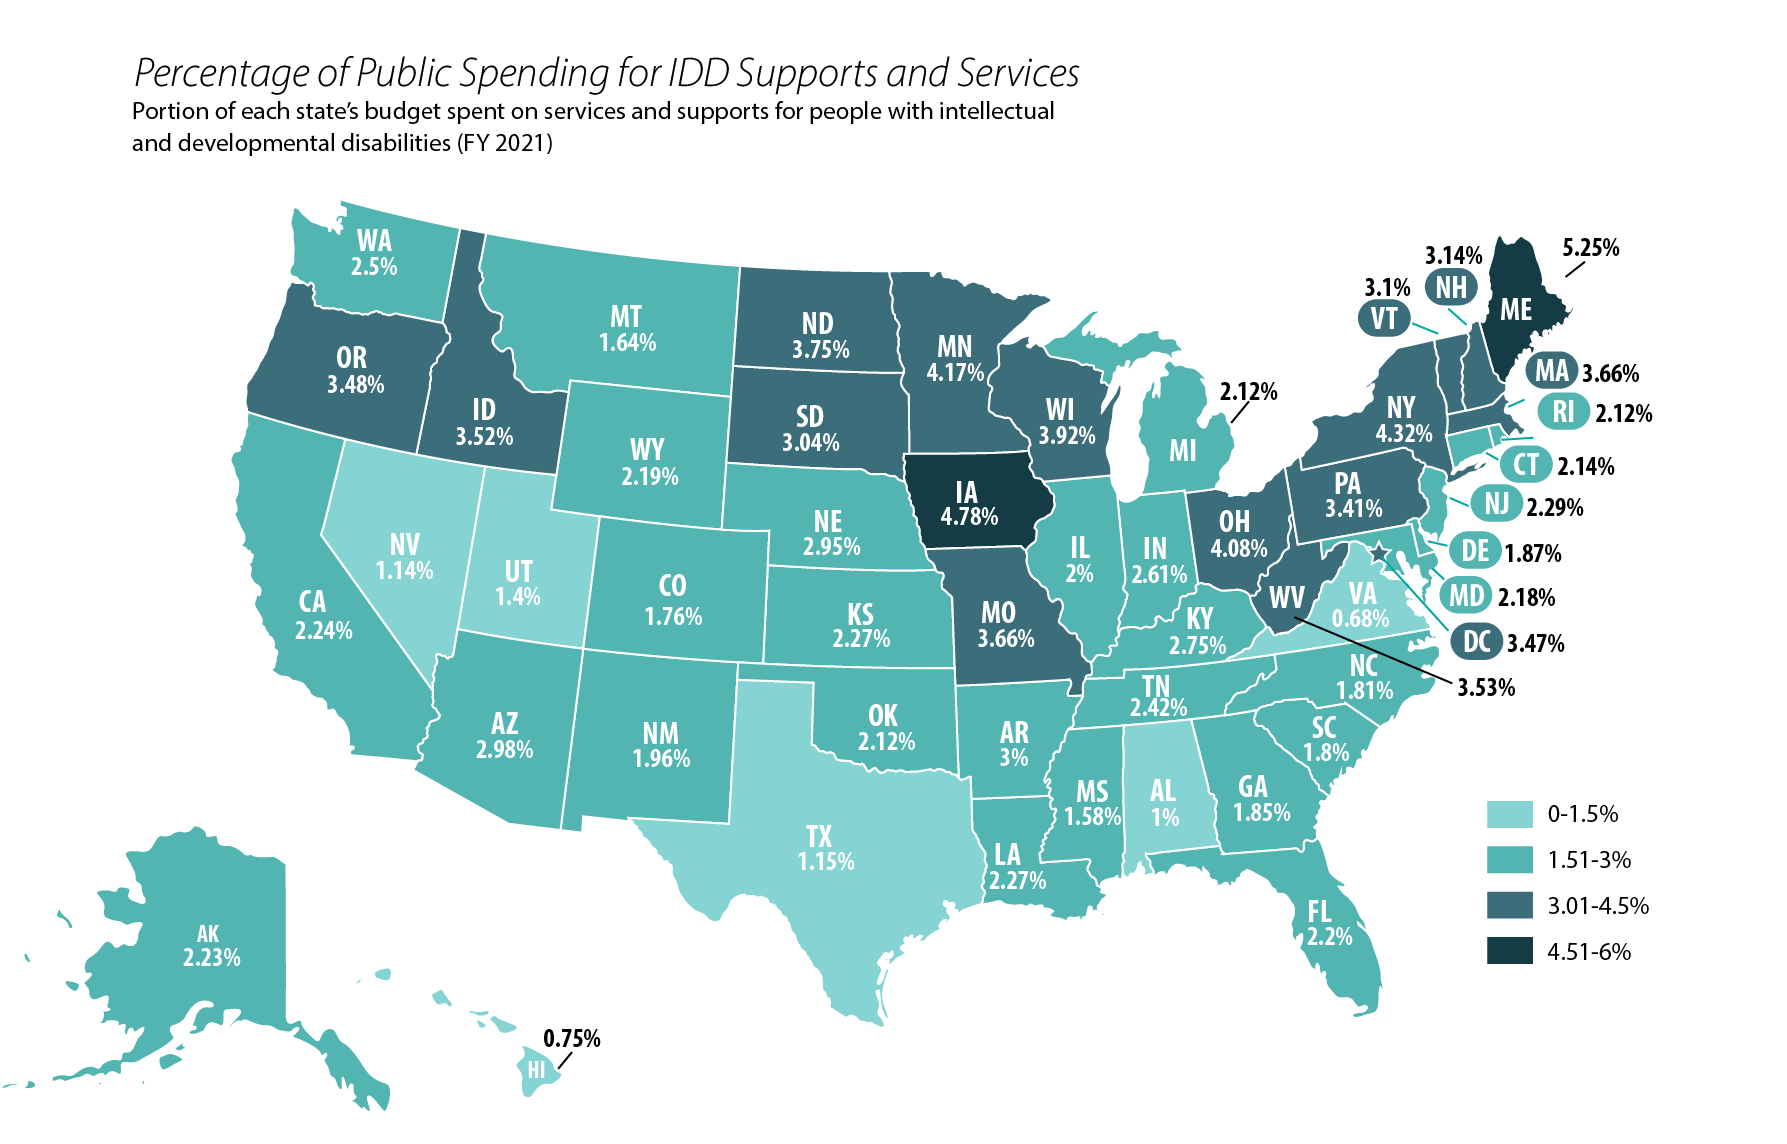
As a percentage of each state’s budget, supports for intellectual and developmental disability services make up between less than 1% and up to 6% of any state’s budget, or an average of 2.57%. This is illustrated in the map below.

This map of the United States shows the percentage of public spending in each state for IDD supports and services, ranging from .75% in Hawaii to 5.25% in Maine.


After Olmstead, funding shifted away from congregate settings:


Tuesday, August 15, 2023

Prevalence and State-Level Autism Resources

In The Politics of Autism, I discuss evaluation, diagnosis, and the uncertainty of prevalence estimates.

 Johanna S. Kester and colleagues have an article in The Journal of Disability Policy Studies titled "Variance in Autism Prevalence: Links With State-Level Autism Resources."  Abstract:

The prevalence of autism spectrum disorder (ASD) has varied over time and across the United States. This variability is likely related to external factors, such as regional differences in ASD-related resources. The study reported on here examined the links between ASD prevalence as measured by Individuals with Disabilities Education Act (IDEA) Part B child count data and four aspects of state infrastructure (health care and insurance policies, clinical resources, research infrastructure, and awareness-raising individuals/organizations). This study also investigated whether these constructs varied by geographical region. The data for this study were abstracted from publicly available databases. Information on state infrastructure was gathered from high-quality reports, resource guides, certificant registries, and databases. More comprehensive ASD-relevant insurance and health care policies, more clinical resources, and greater research infrastructure were associated with higher ASD state prevalence rates as measured by the IDEA Part B child count data. Prevalence of ASD was higher in eastern U.S. states compared with southern U.S. states, but state-level ASD resources did not statistically significantly differ across geographic regions. Implications for research, practice, and policy are discussed.


Sunday, September 20, 2020

Politics and School-Based Autism Rates

We reviewed federal special education data to determine school-identified prevalence of Autism Spectrum Disorder (ASD) and other disability categories by U.S. state. We also examined whether state-level policies, demographic factors, and rates of other eligibility categories are predictive of these state ASD rates. Results indicate that overall, 1 of 81 school-aged children are served under an ASD special education eligibility. State-level demographic factors, such as socioeconomic status and political leanings were highly predictive of rates of ASD. States with higher rates of ASD had lower rates of intellectual and learning disabilities, but higher rates of Other Health Impairment (OHI).
From the article:
The results from this study provide further support for the idea that ASD prevalence rates by state are associated with SES factors, including the proportion of special education students being served under an ASD eligibility (Palmer et al. 2005; Sullivan 2013; Thomas et al. 2011). Despite evidence that SES factors and race/ethnicity are intertwined in their relation to ASD identification (Fountain et al. 2011), we failed to improve our model by including race as a predictor. Our findings also indicate that political leanings on the state level might be partially implicated in these discrepancies. In fact, the model that included political leanings explained about 6% more of the variance in ASD rates than did the model including only income and education as predictors. After removing the outlier of Iowa, the model of just state-level demographic factors of politics, household income, and average adult education accounted for 40% of the proportion ASD by state. This same model failed to predict the overall proportion of students in special education by state, indicating that ASD specifically, and not simply special education services, is tied to these demographic factors. Interestingly, states with centrist politics had higher ASD rates than Democratic or Republican states after controlling for income and education. While the reason for this specific group difference warrants further investigation, the overall finding implicates the role of politics in ASD prevalence at the state level. This may be due to the impact of either policies or simply collective values within states around different special education eligibility categories.

Monday, October 7, 2019

Variability in Medicaid Waivers

The Politics of Autism includes an extensive discussion of insurance and  Medicaid services for people with intellectual and developmental disabilities

Jessica Keim-Malpass, Leeza Constantoulakis, and Lisa C. Letzkus have an article at Health Affairs titled "Variability In States’ Coverage Of Children With Medical Complexity Through Home And Community-Based Services Waivers."  The abstract:
Even though children with medical complexity represent less than 1 percent of the US pediatric population, they are among the costliest users of the health care system. Much of the care for these children is delivered in home and community-based settings and covered by Medicaid waivers under Section 1915(c). Expenditures related to these waivers have been steadily increasing, with most recent estimates showing spending that exceeds $48 billion per year. Little is known about these waivers’ economic impact or effectiveness, because their components and coverage have not previously been well defined. Our study addressed this paucity of data by analyzing the scope of coverage offered by the waivers and evaluating how states are using them to cover children with medical complexity. We found great variability in how states choose to interpret scope of coverage and services offered, and this variability may have an impact on child and family outcomes.
From the article:
This analysis expanded upon the work performed by Douglas Leslie and colleagues 30–32
when they assessed Section 1915(c) waivers specifically for children with a diagnosis of autism spectrum disorder. As our study did, their work demonstrated that waivers targeting autism differ substantially across states in the types and breadth of services covered and restrictions (for example, cost containment strategies) used.30–32 When the authors applied service coverage as a predictor of child and family outcomes using
data from the National Survey of Children’s Health, they demonstrated that use of the waivers significantly decreased unmet needs for children with autism32 and that  increases in cost limits and enrollment limits (that is, allowing more children to be covered by a waiver for longer amounts of time) significantly reduced the likelihood that a parent had to stop working.30 We broadened the analysis by including waivers for all children, and our findings can be used in a similar fashion to assess the relationship between waiver characteristics and child or family outcomes for all children with medical complexity. Furthermore, formal economic evaluations are needed to understand the impact and effectiveness of waiver coverage and characteristics on health and family-centered outcomes, at both the individual and state levels.
30 Leslie DL, Iskandarani K, Velott DL, Stein BD, Mandell DS, Agbese E, et al. Medicaid waivers targeting
children with autism spectrum disorder reduce the need for parents to stop working. Health Aff
(Millwood). 2017;36(2):282–8.
31 Velott DL, Agbese E, Mandell D, Stein BD, Dick AW, Yu H, et al. Medicaid 1915(c) home- and community-based services waivers for children with autism spectrum disorder. Autism. 2016;20(4):473–82.
32 Leslie DL, Iskandarani K, Dick AW, Mandell DS,Yu H, Velott D, et al. The effects of Medicaid home and community-based services waivers on unmet needs among children with autism spectrum disorder. Med Care.
2017;55(1):57–63 

Monday, July 8, 2019

Generosity of Insurance Mandates

The Politics of Autism includes an extensive discussion of insurance and explains the limits of insurance mandates:
There are no exact figures available, but suppose that we take the total number of autistic people and subtract the following:
• Those in states without mandates;
• Those who live in states with mandates but are under exempt, self-funded plans;
• Those with individual and small group policies to which post-2011 mandates do not apply, and
• Those who have already gone over the various limits and caps.
The remainder surely makes up a minority of the autistic population.  
At PLOS ONE, Timothy Callaghan and Steven Sylvester have an article titled "Autism Spectrum Disorder, Politics, and the Generosity of Insurance Mandates in the United States."  The abstract:
The study of Autism Spectrum Disorder (ASD) in the United States has identified a growing prevalence of the disorder across the country, a high economic burden for necessary treatment, and important gaps in insurance for individuals with autism. Confronting these facts, states have moved quickly in recent years to introduce mandates that insurers provide coverage for autism care. This study analyzes these autism insurance mandates and demonstrates that while states have moved swiftly to introduce them, the generosity of the benefits they mandate insurers provide varies dramatically across states. Furthermore, our research finds that controlling for policy need, interest group activity, economic circumstances, the insurance environment, and other factors, the passage of these mandates and differences in their generosity are driven by the ideology of state residents and politicians–with more generous benefits in states with more liberal citizens and increased Democratic control of state government. We conclude by discussing the implications of these findings for the study of health policy, politics, and autism in America.
From the article:
Even as forty-six states took action from 2001–2017 to enact an insurance mandate, the scope of these benefits varies dramatically. A select number of states have mandated generous benefits, but we show that this is far from the norm. Instead, most states limit benefits by either restricting eligibility to individuals under a certain age or by capping the amount that insurance companies must spend to pay for needed behavioral treatments. Thus, our findings suggest that even as states have moved quickly to reform their policies, the number of individuals who are eligible for generous benefits varies dramatically.

Sunday, April 15, 2018

Differences Among States in Autism Prevalence

In The Politics of Autism, I discuss the uncertainty surrounding estimates of autism prevalence. 

At The Journal of Autism and Developmental Disorders, R. Christopher Sheldrick and Alice S. Carter have an article titled" State-Level Trends in the Prevalence of Autism Spectrum Disorder (ASD) from 2000 to 2012: A Reanalysis of Findings from the Autism and Developmental Disabilities Network." The abstract:
Since 2000, the Autism and Developmental Disabilities Network (ADDM) has published detailed prevalence estimates for autism spectrum disorder (ASD) among 8 year-olds, which are widely interpreted as the U.S. national prevalence of ASD. Although differences in state-level ASD prevalence has been reported, state-level heterogeneity has not been explored systematically. We analyzed state-level estimates and trends in ASD prevalence from 2000 to 2012 using secondary data from bi-annual ADDM reports. Heterogeneity among state-level ASD prevalence estimates were apparent in 2000 and grew between 2000 and 2012. Findings highlight the need for greater understanding of how children with ASD are identified by the medical and educational systems, which has significant implications for the state-level resources required to effectively manage ASD.
New Jersey has the highest prevalence, Alabama the lowest.  Why?

From the article:
Consideration of such differences is important for at least two reasons. First, a large proportion of service delivery for ASD is managed at the state level. Strong differences in ASD prevalence at the state level therefore have implications for the resources required to provide adequate services (Wise et al. 2010). Second, improved understanding of the causes of observed changes in ASD prevalence may depend on a
more detailed understanding of heterogeneity. For example, the ADDM and others have speculated that trends in ASD prevalence over time may be attributable either to changes
in the true prevalence of ASD, for example resulting from trends in exposure to risk factors such as environmental toxins, or changes in the ascertainment of ASD, for example attributable to increased awareness of or sensitivity to ASD symptoms (Blumberg et al. 2013; Centers for Disease Control and Prevention 2014; Hansen et al. 2015; Idring et al. 2015). 
  • Blumberg, S. J., Bramlett, M. D., Kogan, M. D., Schieve, L. A., Jones, J. R., & Lu, M. C. (2013). Changes in prevalence of parent-reported autism spectrum disorder in school-aged U. S. children: 2007 to 2011–2012. National Health Statistics Reports, 65, 1–11.Google Scholar
  • Centers for Disease Control and Prevention. (2014). Prevalence of autism spectrum disorder among children aged 8 years—Autism and Developmental Disabilities Monitoring Network, 11 sites, United States, 2010. MMWR, 63(SS-2), 1–21.Google Scholar
  • Hansen, S. N., Schendel, D. E., Parner, E. T. (2015). Explaining the increase in the prevalence of autism spectrum disorders. JAMA Pediatrics, 169(1), 56. https://doi.org/10.1001/jamapediatrics.2014.1893.CrossRefPubMedGoogle Scholar
  • Idring, S., Lundberg, M., Sturm, H., Dalman, C., Gumpert, C., Rai, D., … Magnusson, C. (2015). Changes in prevalence of autism spectrum disorders in 2001–2011: Findings from the Stockholm youth cohort. Journal of Autism and Developmental Disorders, 45(6), 1766–1773. https://doi.org/10.1007/s10803-014-2336-y.CrossRefPubMedGoogle Scholar
  • Wise, M. D., Little, A. A., Holliman, J. B., Wise, P. H., & Wang, C. J. (2010). Can state early intervention programs meet the increased demand of children suspected of having autism spectrum disorders? Journal of Developmental and Behavioral Pediatrics, 31(6), 469–476. https://doi.org/10.1097/DBP.0b013e3181e56db2.PubMedGoogle Scholar

Thursday, April 6, 2017

Policies on Restraint and Seclusion


Teri A. Marx and Joshua N. Baker have an article at the Journal of Disability Policy Studies titled "Analysis of Restraint and Seclusion Legislation and the Policy Across States: Adherence to Recommended Principles."  The abstract:
This review examines each state’s educational legislation and policies on restraint and seclusion in relationship to their alignment with the U.S. Department of Education’s (U.S. DOE) Restraint and Seclusion: Resource Document. Although the Resource Document is not a federal mandate, it provides the U.S. DOE’s recommendations for policy and legislation to reduce the use of restraint and seclusion in schools and create safe learning environments for all students. State educational legislation and policies on restraint and seclusion were coded and compared with the U.S. DOE Resource Document’s 15 guiding principles. Results were variable and found that some states’ policies adhered more to the guiding principles than their legislation. In addition, some states recognize the document in their legislation and policy. A summary of the descriptive data and current state statuses are reported.
The conclusion:
The present investigation examined states’ legislation and policy in relationship to the guiding principles as a way to identify whether states are incorporating best practices, including preventive and proactive approaches, in their restraint/seclusion legislation and policy. Thirty-eight states have existing legislation and 45 have policy on restraint and seclusion, with improvement noted over time. Now that federal guidance is available, states may want to revisit their existing policies and legislation on restraint and seclusion
and consider alignment with the guiding principles. The U.S. DOE’s release of the  esource Document provides the first evidence of federal guidance with regard to restraint and seclusion. Although the Resource Document is not a federal mandate, it is the most current federal guidance to date on restraint and/or seclusion, and is presently the best source of guidance for states to consider for reducing the use of restraint/seclusion and for promoting safe learning environments.